We are currently working on some educational stock posts where we are discussing how to find stock investments for various strategies from day trading to long term investing.
The information will be fact-based while we use recorded stock events where we referenced the stock movement to the origin of the trigger. Feel free to use some of our tools, such as the scanners. Access is free but registration is required.
What triggers a stock to move up or down is based how many shares are being bought and sold.

In value trading or value investing, investors buy shares of stocks from companies with the goal that those will return adequate returns.
The old principles of stock investing have however changed quite a bit over the years and especially with the rise of social media, but most are still valid. If you are interested of realizing profits in the stock market, then learning the basics of what impacts a stocks performances.
Important links!

Stock Basics!
The stock market is a future projection of what investors believe is going to happen with a company or the economy overall.
Profits can be generated by investing in stocks that will increase on value over a specified timeframe. Every decision made towards a stock buy or sell must be based logic, a valid defined strategy or goal. Hope, belief or following someone’s unverifiable advice are not strategies.
Tips!
The most import thing in stock trading is having an exit strategy in place. You should strongly consider setting up limits so that losses remain minimal and profits will protected.
Example!
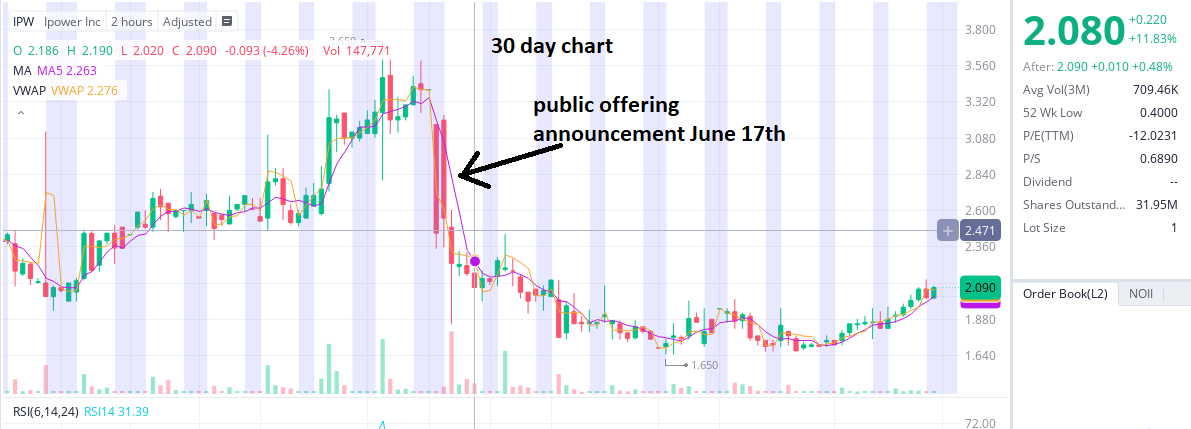
Above is a 30 day graph of Ipower Inc. Noticing the big drop (red candle) after a 6 session upwards performance. The big drop occurred on 6/18 at 8am during the pre-market session.
The stock price plunged from $3.30 to below $2.40 because the company iPower Inc. announced $5 Million Registered Direct Offering at a price of $2.40 per share on June 17th.
As news play vital roles in stock development, (a lot of investors act on news) it is important to account for such news as good as possible.
News! Good or Bad!
As news play vital roles in stock development, (a lot of investors act on news) it is important to account for such news as good as possible.
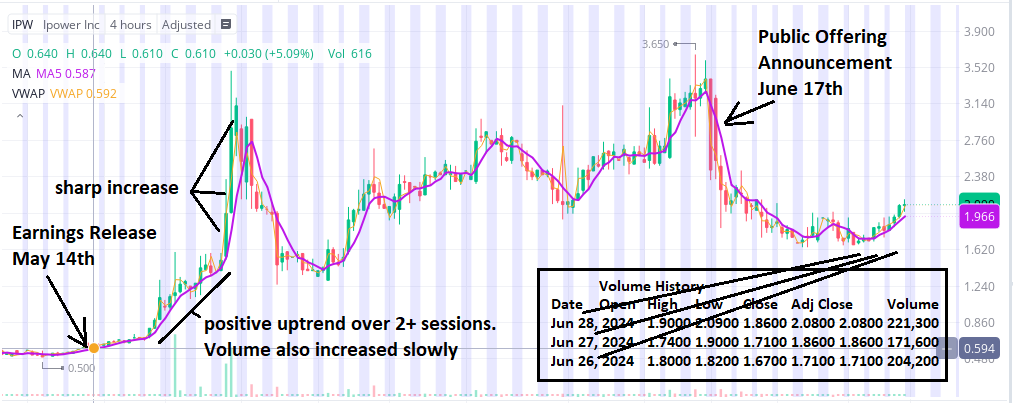
Above is IPW on a 3-month chart. 3-month or 90-days is a long time to hold a penny stock. Penny stocks or stocks that are cheap see a lot of fluctuation and volatility because those are relatively cheap and tend to get “recycled” by short-term investors quite often. Looking at a stocks volume history will provide some indications about the development.
Earnings – News! Good or Bad!
The stock of iPower was about $o.594 on May 14th when the company filed the earnings release with the SEC. It seems with high probably that that this gave the stock some upwind. Going back looking at the volume history at the time from May 14th – May 17th, a investor who keeps an eye on earnings calendars and past stock performance, would have had to deal with almost “no risk” in order to capitalize on such an investment
Trading Risks!
The example that is shown here is something and much more that can occur in the stock investing world. You can study any chart of any stock and you will find similar patters and behaviors over and over. Every publicly company has to report earnings and stocks mostly start moving prior to earning releases.
When you look at the 3-month chart you see that the modest stock gains followed by larger green candles (buys). You will also find volume increases in the history and that will tell us that the volatility (fluctuation) increased with the increase of the stock price. Some investors are long-term (small green candles) but when you notice sharp increases (green candle spikes) than you should be on notice that sharp declines (profit takers) can occur.


