| Date | Open | High | Low | Close | Adj Close | Volume |
|---|---|---|---|---|---|---|
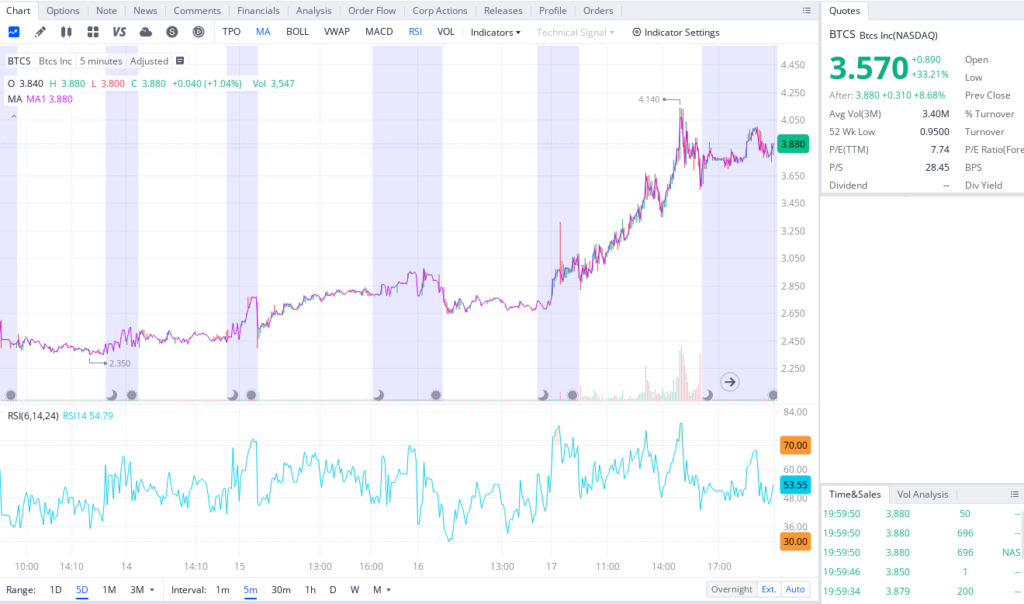
| Jan 17, 2025 | 2.9000 | 4.1400 | 2.8200 | 3.5700 | 3.5700 | 7,894,900 |
| Jan 16, 2025 | 2.8400 | 2.8400 | 2.6500 | 2.6800 | 2.6800 | 216,100 |
| Jan 15, 2025 | 2.4800 | 2.8350 | 2.4700 | 2.7800 | 2.7800 | 461,900 |
| Jan 14, 2025 | 2.4000 | 2.5300 | 2.4000 | 2.4800 | 2.4800 | 153,100 |
| Jan 13, 2025 | 2.5000 | 2.5100 | 2.3500 | 2.3700 | 2.3700 | 152,600 |
| Jan 10, 2025 | 2.5600 | 2.5750 | 2.4300 | 2.5400 | 2.5400 | 258,300 |
| Jan 8, 2025 | 2.5700 | 2.5700 | 2.3700 | 2.4900 | 2.4900 | 263,700 |
| Jan 7, 2025 | 2.8000 | 2.8000 | 2.5600 | 2.5700 | 2.5700 | 225,800 |
| Jan 6, 2025 | 2.8600 | 2.8600 | 2.7100 | 2.7700 | 2.7700 | 334,300 |
| Jan 3, 2025 | 2.6400 | 2.7550 | 2.5700 | 2.7400 | 2.7400 | 309,400 |
| Jan 2, 2025 | 2.5400 | 2.6300 | 2.4100 | 2.6200 | 2.6200 | 269,100 |
| Dec 31, 2024 | 2.5400 | 2.6900 | 2.3900 | 2.4700 | 2.4700 | 464,200 |
| Dec 30, 2024 | 2.4800 | 2.58 |
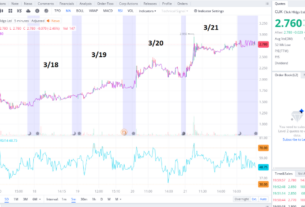
The stock was a buy based on the information we had. The 5 day performance even without any news made this stock a buy. The volume was relatively low. The risk level was low due to the conditions and to the fact that setting (stop-loss) or other limits based on the chart development would have been very low.


